OIL-ALL
SOURCE:
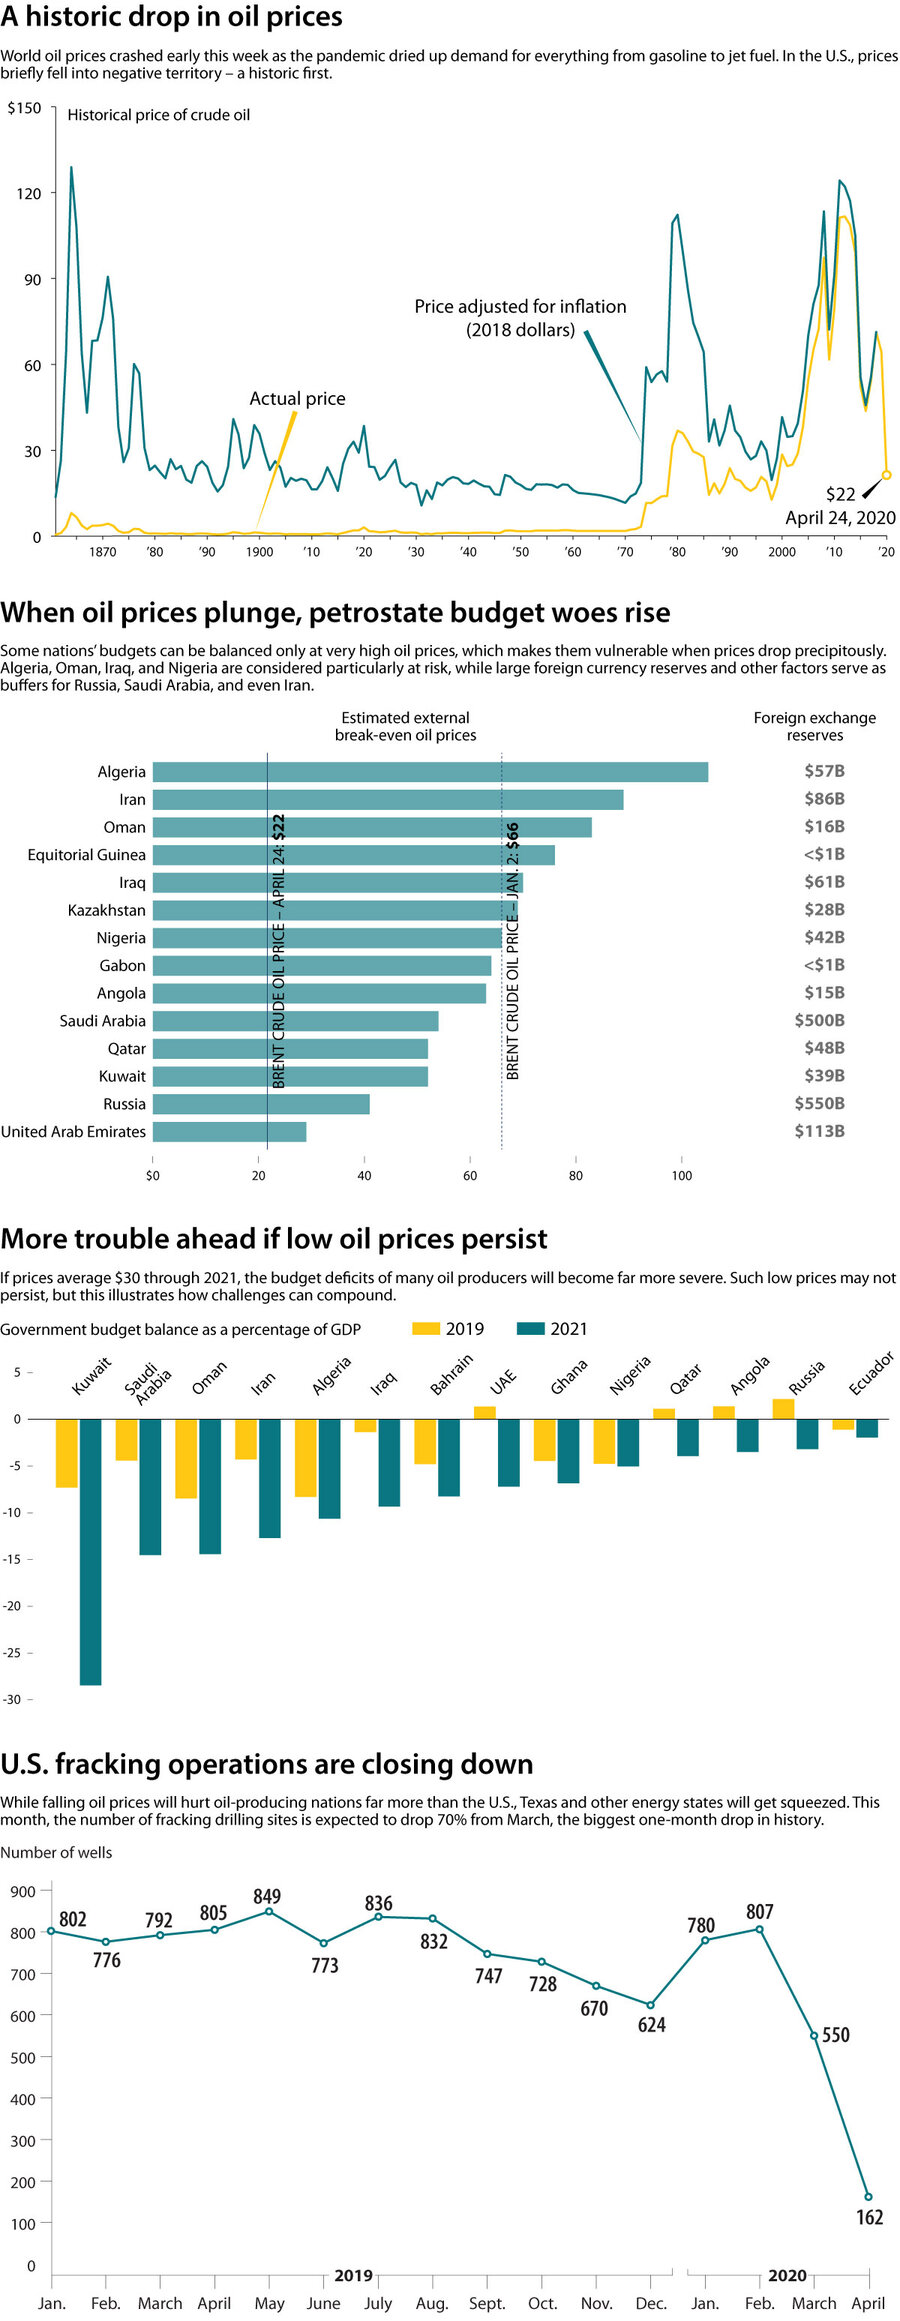
Chart 1: BP Statistical Review for 2019 (data for 1861 to 2018), U.S. Energy Information Administration (2019 monthly average), Intercontinental Exchange (April 23, 2020 price); Chart 2: Council on Foreign Relations, Energy Intelligence, CEIC, Nasdaq; Chart 3: Atradius N.V., Oxford Economics Global Economic Model; Chart 4: Rystad Energy
|
Jacob Turcotte and Karen Norris/Staff